Following the Government’s release of their housing affordability discussion paper,“Towards a New Housing Strategy,” in July 17 and the recent release of 2016 Census data, we wanted to take a closer look at housing affordability in Canberra and across the nation.
What do the numbers tell us?
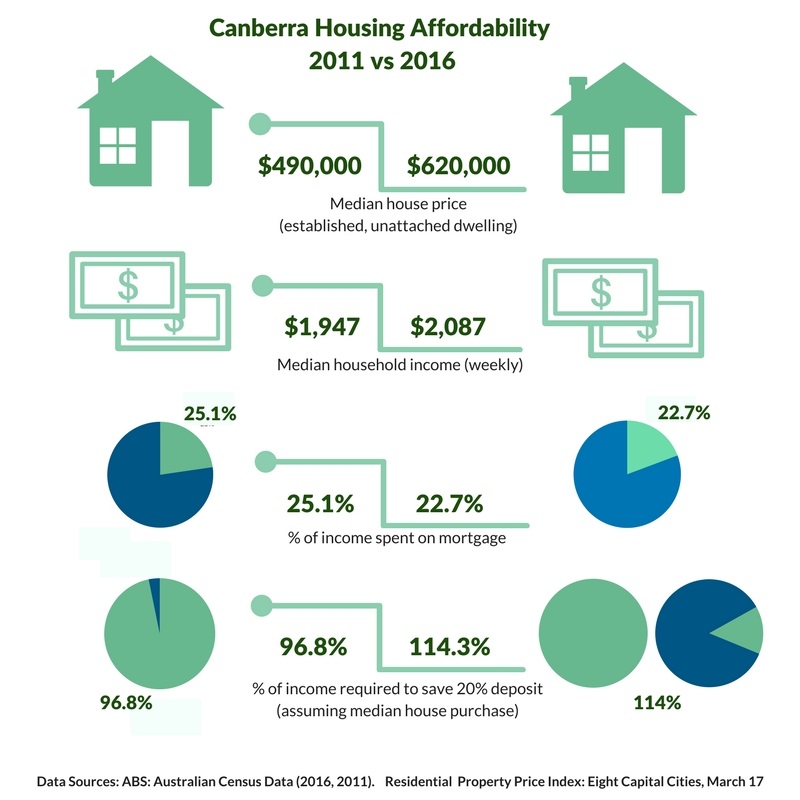
2016 Census data tells us the Canberra median weekly household income is $2,087, the second highest in the country behind Darwin. Canberra’s comparatively high household income is likely to be explained by the high proportion of dual income families and public servant households.
According to the ABS Residential Property Price Index, Canberra’s median house price was $620,000 at the time of the Census.
The median price for an “attached property” – this includes units, apartments and townhouses – was $435,000.
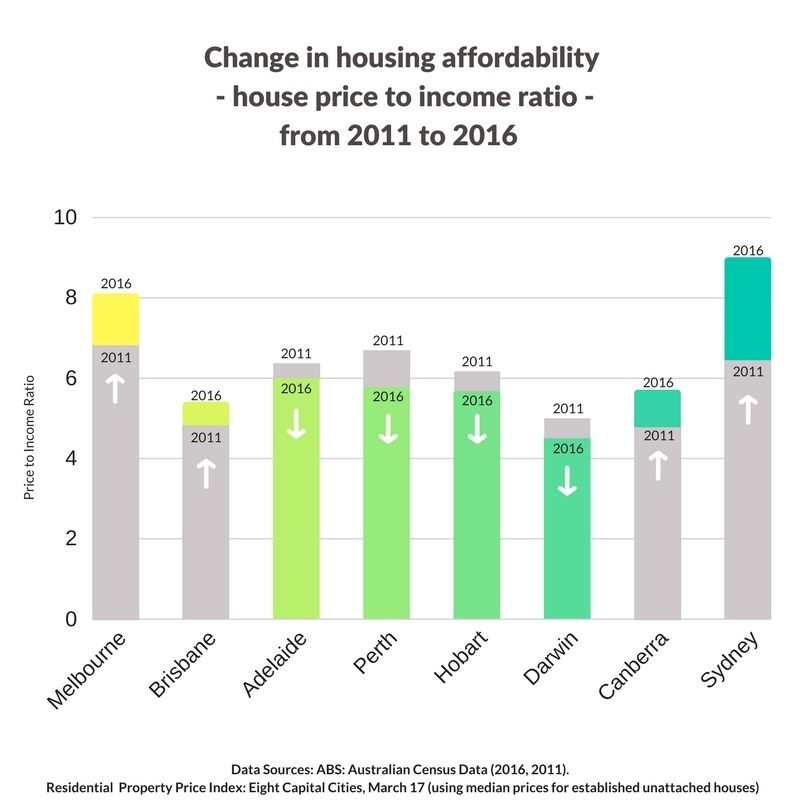
For Canberrans wanting to purchase a house, it’s likely to cost 5.7 times the average annual household income.
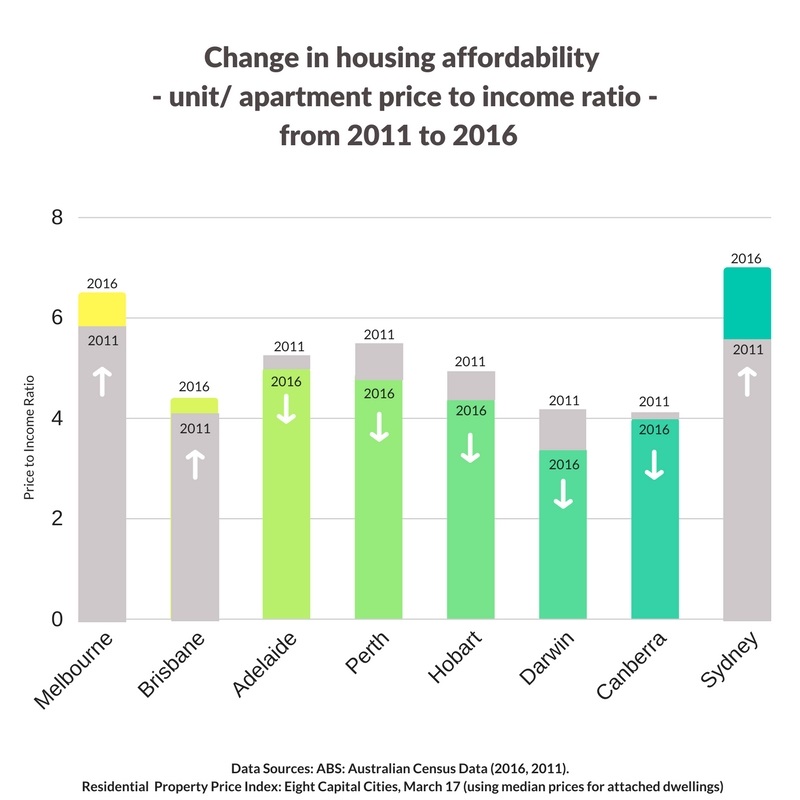
It doesn’t cost quite as much to purchase an apartment, with a median priced Canberra apartment costing 4 times the average annual household income.
How have things changed over the past 6 years?
With the median monthly mortgage payment for Canberrans recorded at $2,058 in 2016, we’re spending 22.7% of our income on mortgage repayments. This has fallen from 25%, according to the 2011 Census.
Whilst this decline is most likely explained by the falling interest rates, we like to think it’s also because we’ve helped more Canberrans reduce their home loan costs!
The proportion of household income Canberrans spend on rent is also lower, falling from 19.3% in 2011 to 18.7% in 2016.
A snapshot: Canberra Housing Affordability 2011 vs 2016:

How does Canberra compare with the rest of the nation?
Using weekly household income amounts (Census data) and median property prices (ABS Residential Property Price Indicies), the following graphs show how property prices (first houses, then apartments) compare with annual household incomes across Australia.
Or more succinctly, we’re comparing housing affordability across Australia. The higher the Price to Income ratio, the less affordable it is to buy property in that State or Territory.


Sydneysiders now need an amount 9.0 times the median annual household income to purchase a house. This is a significant jump from the Price to Income ratio of 6.3 measured in 2011.
We won’t contribute to the Sydney property price discussion here, or suggest reasons for the dramatic price increases. However, we do suspect the steep growth is slowing due to a few factors. Increased regulatory intervention from governments – both here and abroad – to reduce the level of foreign investment, perhaps being the most significant.
The Price to Income ratio for Canberra may be lower than other States, but we know that’s not much comfort if you’re finding it hard to save 20% deposit.
You still need to save 114% of your annual household income – or more! – depending on how your income compares to the Canberra median and what type of property you hope to buy.
In our October Update, we’ll explain some alternative options that may be available to you, if you’re one of the many first home buyers finding it hard to save your 20% deposit.
Sign up to receive our Monthly Update here, to make sure you don’t miss it!
*Please note there are limitations with any analysis of data and whilst all care has been taken to ensure figures presented here are recorded and collated from reliable sources, MMO provides no assurance of their completeness or accuracy. Given that published data on Australian household income levels and recorded property prices is generally historic in nature, it must also be noted that the data contained herein and any assumptions drawn from this data, may or may not accurately reflect the situation at the date you read this material.

